
They thought the floorboards were the problem.
Measuring underneath the home changed the order of the work.
The owners were dealing with deteriorating timber flooring around the perimeter of the home. The obvious response was to replace the damaged boards.
Before doing that, we measured the conditions around and beneath the affected area. What we found changed where the work needed to start.
The visible damage was only part of the picture.
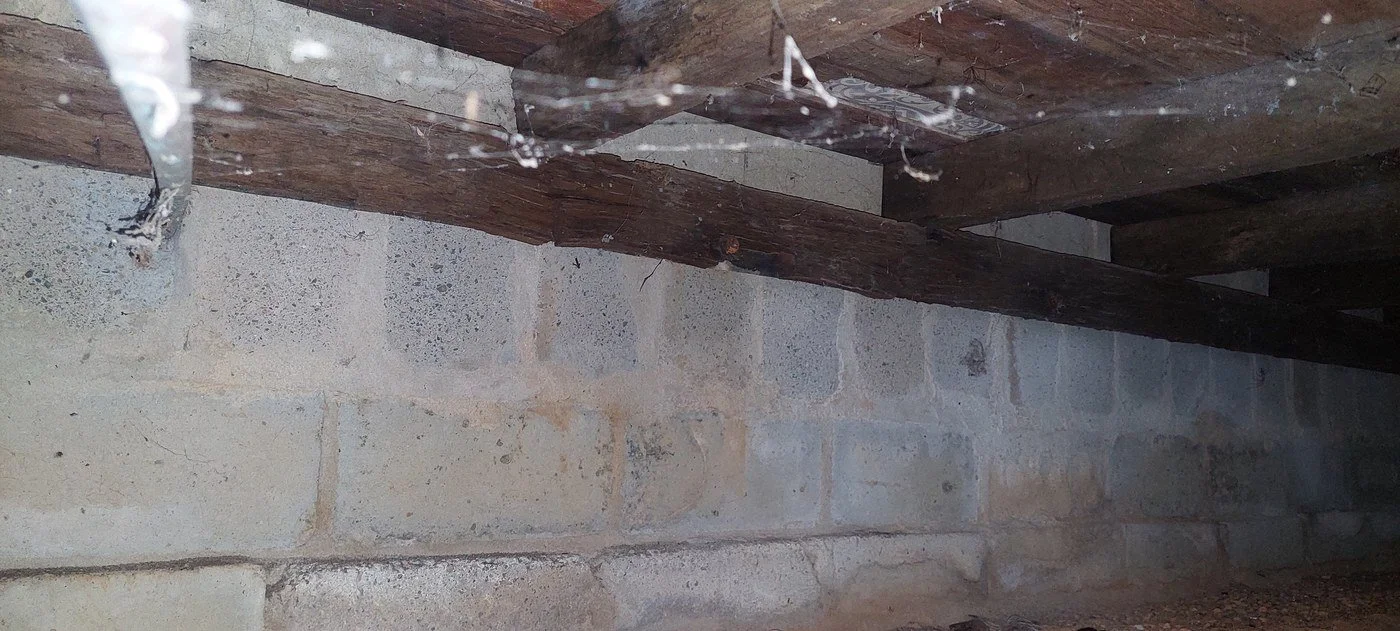
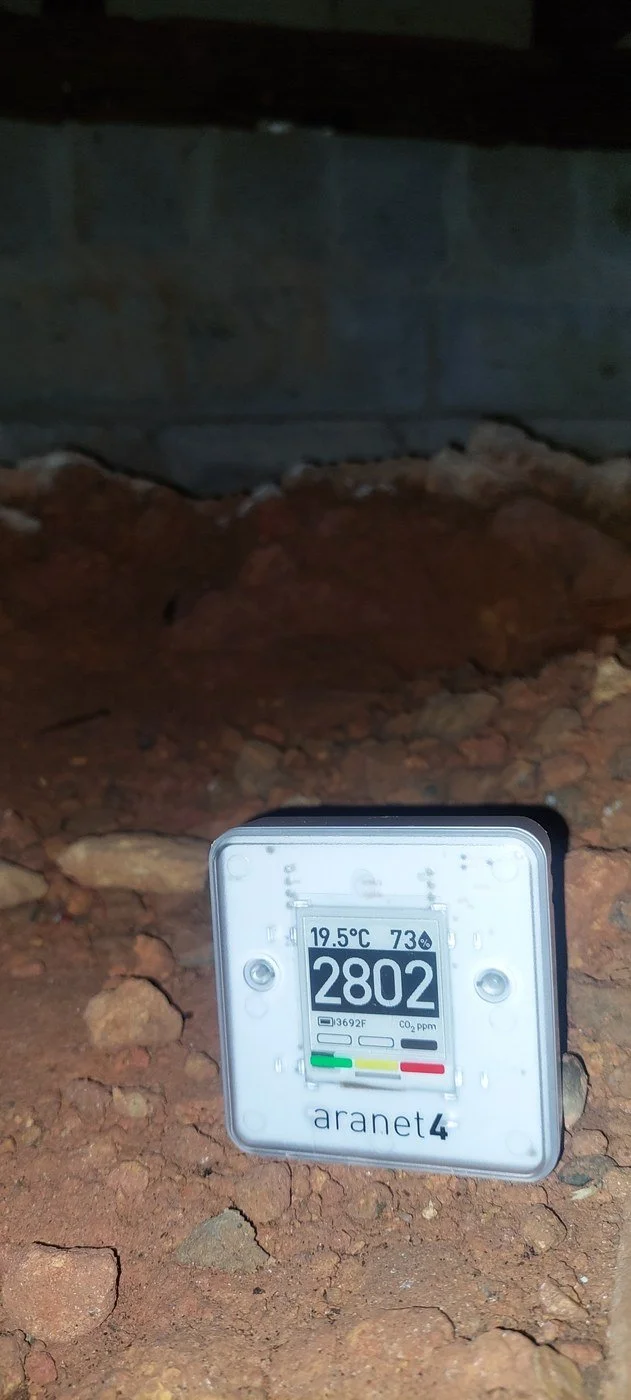
On 14 April 2026 Joe recorded conditions through the kitchen and accessible subfloor areas. The readings showed a large difference between the air beneath the home and the outdoor reference taken during the same visit.
Recorded 14 AprilMoisture readings were also elevated at selected perimeter and subfloor locations. The important point wasn't one isolated number. It was the pattern across the home.
What the readings indicated
The high subfloor CO₂ concentration, elevated humidity, moisture observations and physical ventilation conditions together indicated that the subfloor warranted further investigation before the flooring was replaced.
CO₂ is not being used here as a direct airflow measurement. It is one part of the recorded environmental picture.
Replacing the flooring first would not have addressed the conditions underneath it.
-
Address the subfloor ventilation pathway
Create additional ventilation openings and remove restrictions to air movement.
-
Re-measure
Return to the home and record the conditions again.
-
Then address the flooring
Once the underlying conditions had been investigated and the first intervention completed, the flooring work could be considered with better information.
This is the difference between starting with a repair and starting with measurement.
Additional subfloor ventilation was installed.
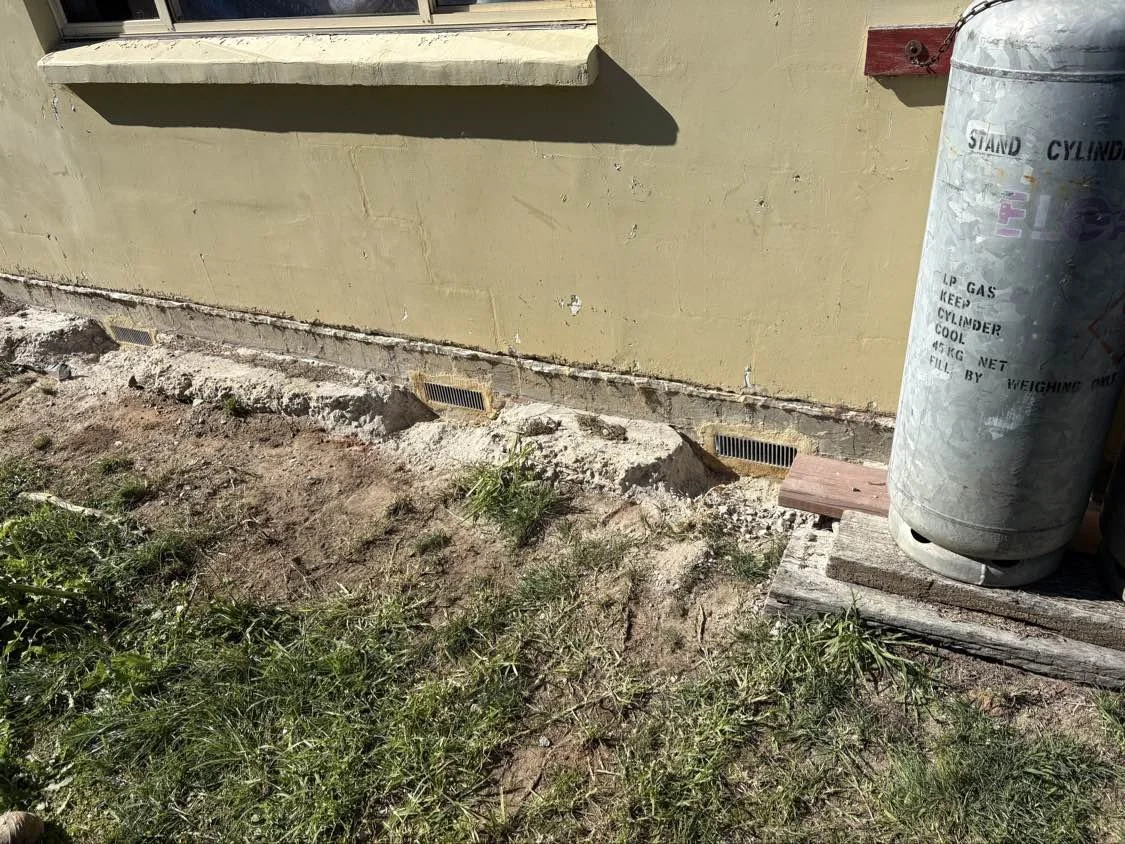
Approximately 20 additional high-flow ventilation openings were added around the subfloor. The purpose was simple: change the ventilation pathway first, then measure what happened.
The air readings beneath the home were substantially lower.
At the return visit on 4 June, documented subfloor CO₂ readings across the tested locations ranged from 672 to 854 ppm. A photographed reading during the return visit recorded 796 ppm.
Important context
These measurements were taken on different days under different environmental conditions. For that reason, we do not treat the CO₂ change by itself as a controlled airflow test.
What we can say is that the recorded subfloor CO₂ concentrations were substantially lower on the return visit. That is the measured observation.
The new openings were also showing measurable air movement.
During the return visit, airflow readings across tested paths were recorded in the approximate range of 0.35 to 0.72 metres per second. One recorded sequence at an opening reached 0.61 metres per second.
Wind conditions were variable during the visit, so these readings are recorded as observations of air movement through the new ventilation pathway. They are not presented as a pre-versus-post airflow comparison, because no equivalent anemometer baseline was recorded before the work.
Not every measurement showed a simple before-and-after result.
This matters.
A moisture meter on the Wood %MC scale recorded 29.6% MC against timber at the first assessment. At the return visit the meter recorded 30.0% MC.
30.0 is the top of this meter's range, so that reading sits at the ceiling of what the instrument can resolve rather than being a precise figure. The timber had not finished moving.
We also do not present these two readings as a matched before-and-after, because the available evidence does not establish that they were taken at the same point on the same member.
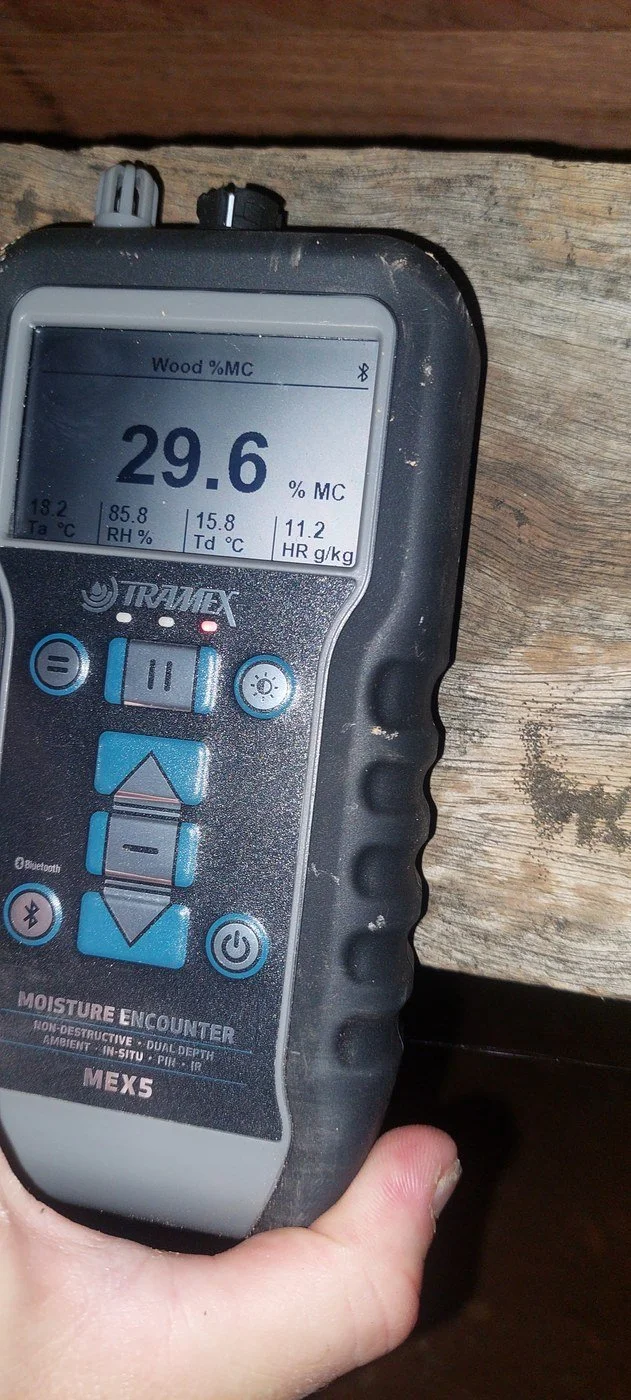
That distinction is deliberate. Measurement is only useful when the comparison is valid. Where the point or method cannot be established, we don't manufacture a conclusion from it.
Recorded at the first visit
- Subfloor CO₂: 2,802 ppm
- Outdoor reference: 506 ppm
- Subfloor RH: 73%
- Moisture indicators: elevated at selected locations
Recorded at the return visit
- Subfloor CO₂: 672 to 854 ppm across documented points
- Photographed subfloor CO₂ reading: 796 ppm
- Air movement through tested paths: approximately 0.35 to 0.72 m/s
What the evidence supports
- The subfloor air readings were substantially lower at the return visit.
- Air movement was recorded through the new ventilation openings.
What the evidence does not yet support
- A controlled claim that one isolated intervention caused every recorded change.
- A verified timber-moisture improvement from the 29.6% MC and 30.0% MC readings.
That is why the record remains useful. It shows what changed, what didn't, and what still needs monitoring.
The floor stopped being the starting point.
The project began as a flooring problem. Measurement showed that the conditions beneath the flooring needed attention first.
- Measure the existing conditions
- Understand the pattern
- Address the ventilation pathway
- Measure again
- Then make the next building decision
That is the Joe Builds approach. Measure → Understand → Recommend → Verify
A visible problem does not always tell you where the work should start.
Before replacing materials, renovating a room or committing to a repair, a measured record can help answer a more useful question: what is the home doing?
That gives you something better than another opinion. It gives you a starting point you can return to.
Joe Builds records readings at identified locations together with the conditions present at the time.
Environmental measurements can change with weather, occupancy, ventilation state and other conditions. Comparisons are therefore reported according to the quality and comparability of the available evidence.
For moisture measurement, the selected instrument scale and material matter. The moisture meter we use has dedicated wood moisture-content scales as well as comparative relative scales for other materials. The timber readings in this case study were taken on the Wood %MC scale.
For CO₂, concentrations are used as part of the wider environmental assessment. CO₂ concentration alone is not treated as a direct measurement of airflow.
Home and owner details have been kept private.
Start with measurement
Something in your home doesn't feel right, or you're about to spend money changing it? Start by understanding the existing conditions.